
Stage 01 / 10
Connect
Point chertBI at your data
Add a database with a standard driver — PostgreSQL works out of the box — choose what SQL users may see and do, or upload CSV and Excel files into an allowed database.
Powered by
Self-hosted business intelligence · English & Arabic
chertBI connects to the databases you already run, turns their tables into trusted metrics, and lets everyone answer their own questions — with a point-and-click explorer, a full SQL workbench and interactive dashboards. Embed any dashboard inside chertERP, keep every byte on your own servers, and work in English or Arabic.
Three ways in
Leaders read the business from dashboards. Analysts go as deep as SQL lets them. ERP owners put the answers where work already happens.
Open a dashboard, set the region and the period, click a slice to filter every other chart, and drill into the rows behind any number — in Arabic or English.
Write SQL with autocomplete, or build charts by pointing and clicking. Define metrics once, certify them, and publish answers the whole company can trust.
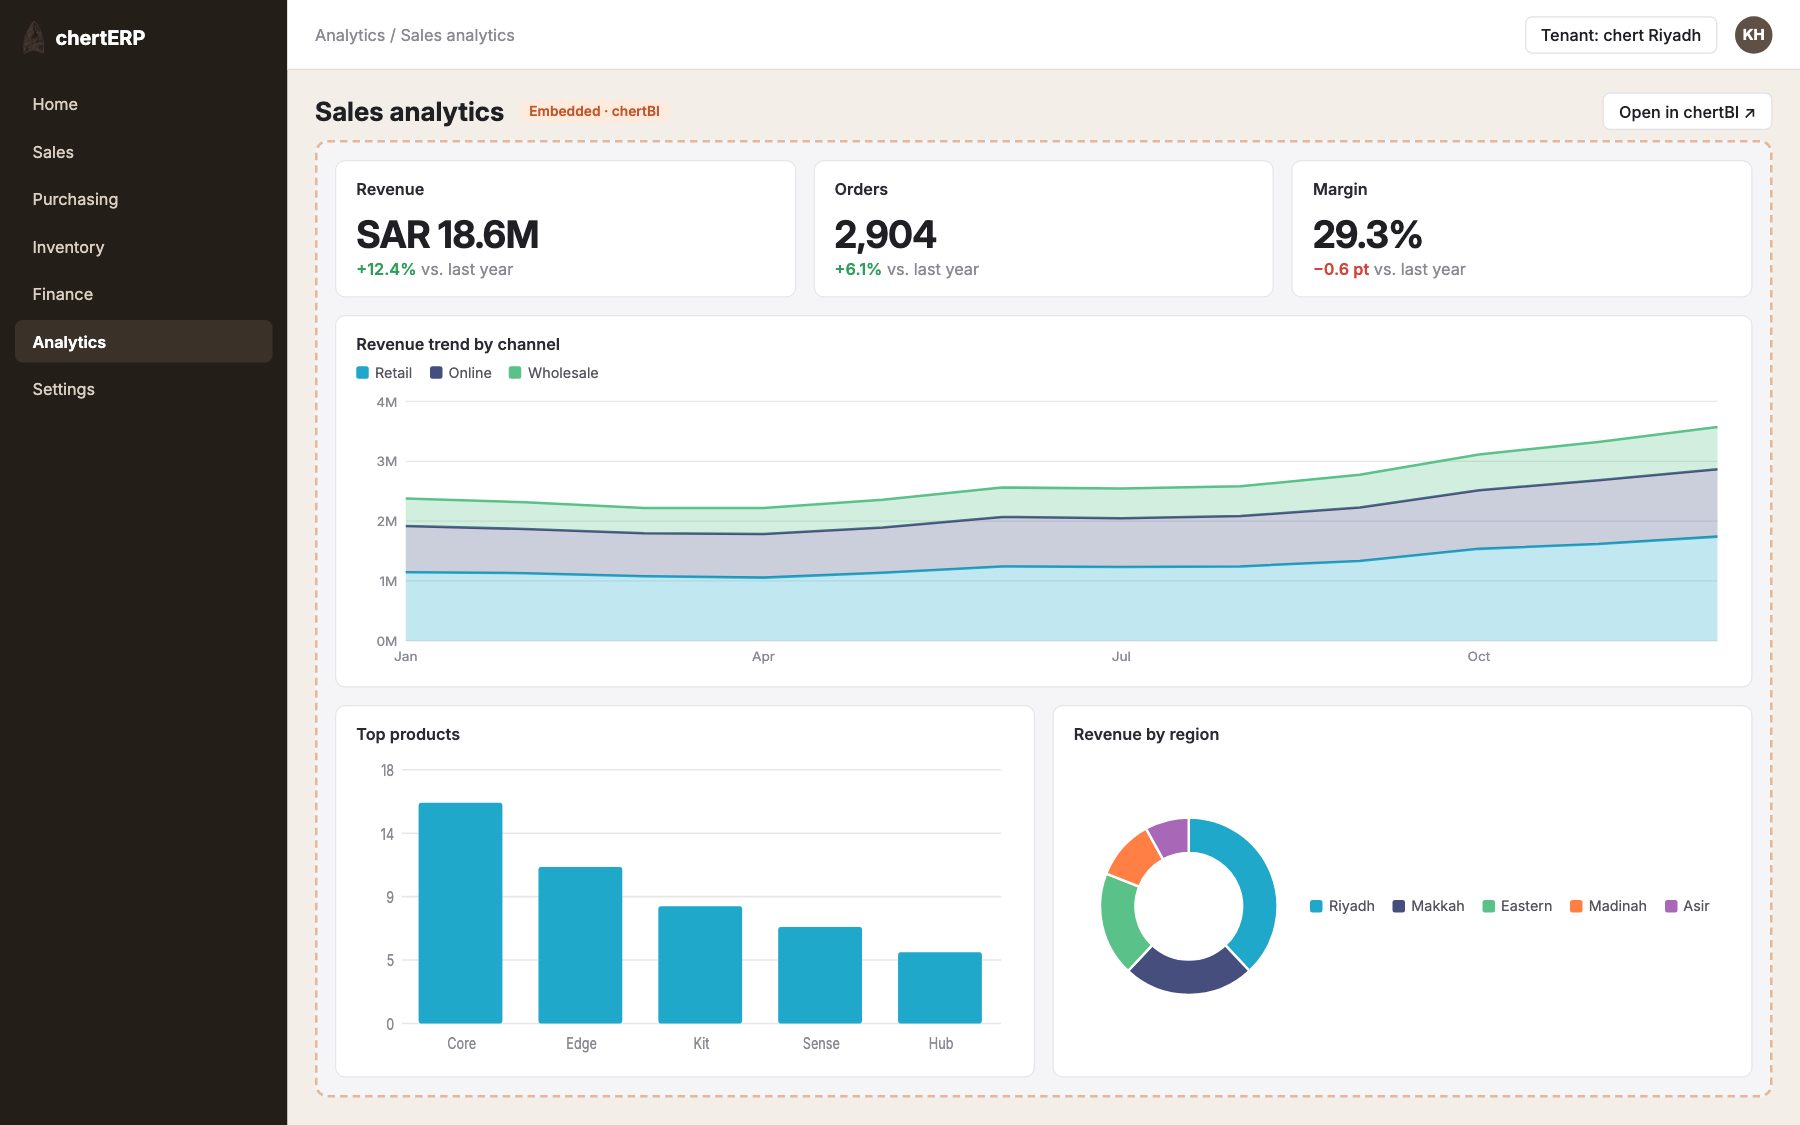
Put BI screens inside ERP menus. Viewers never need a chertBI account, tokens live for five minutes, and every tenant sees only its own rows.
The analytics lifecycle
Ten stages, from a database connection to a governed, embedded dashboard. Select a stage to see what happens — and which parts of chertBI make it work.
Stage 01 / 10
Point chertBI at your data
Add a database with a standard driver — PostgreSQL works out of the box — choose what SQL users may see and do, or upload CSV and Excel files into an allowed database.
Powered by
Stage 02 / 10
Datasets, metrics, meaning
Register tables as datasets or write a virtual dataset in SQL. Define metrics and calculated columns once, describe and format them, and certify the ones people should trust.
Powered by
Stage 03 / 10
Ask in SQL
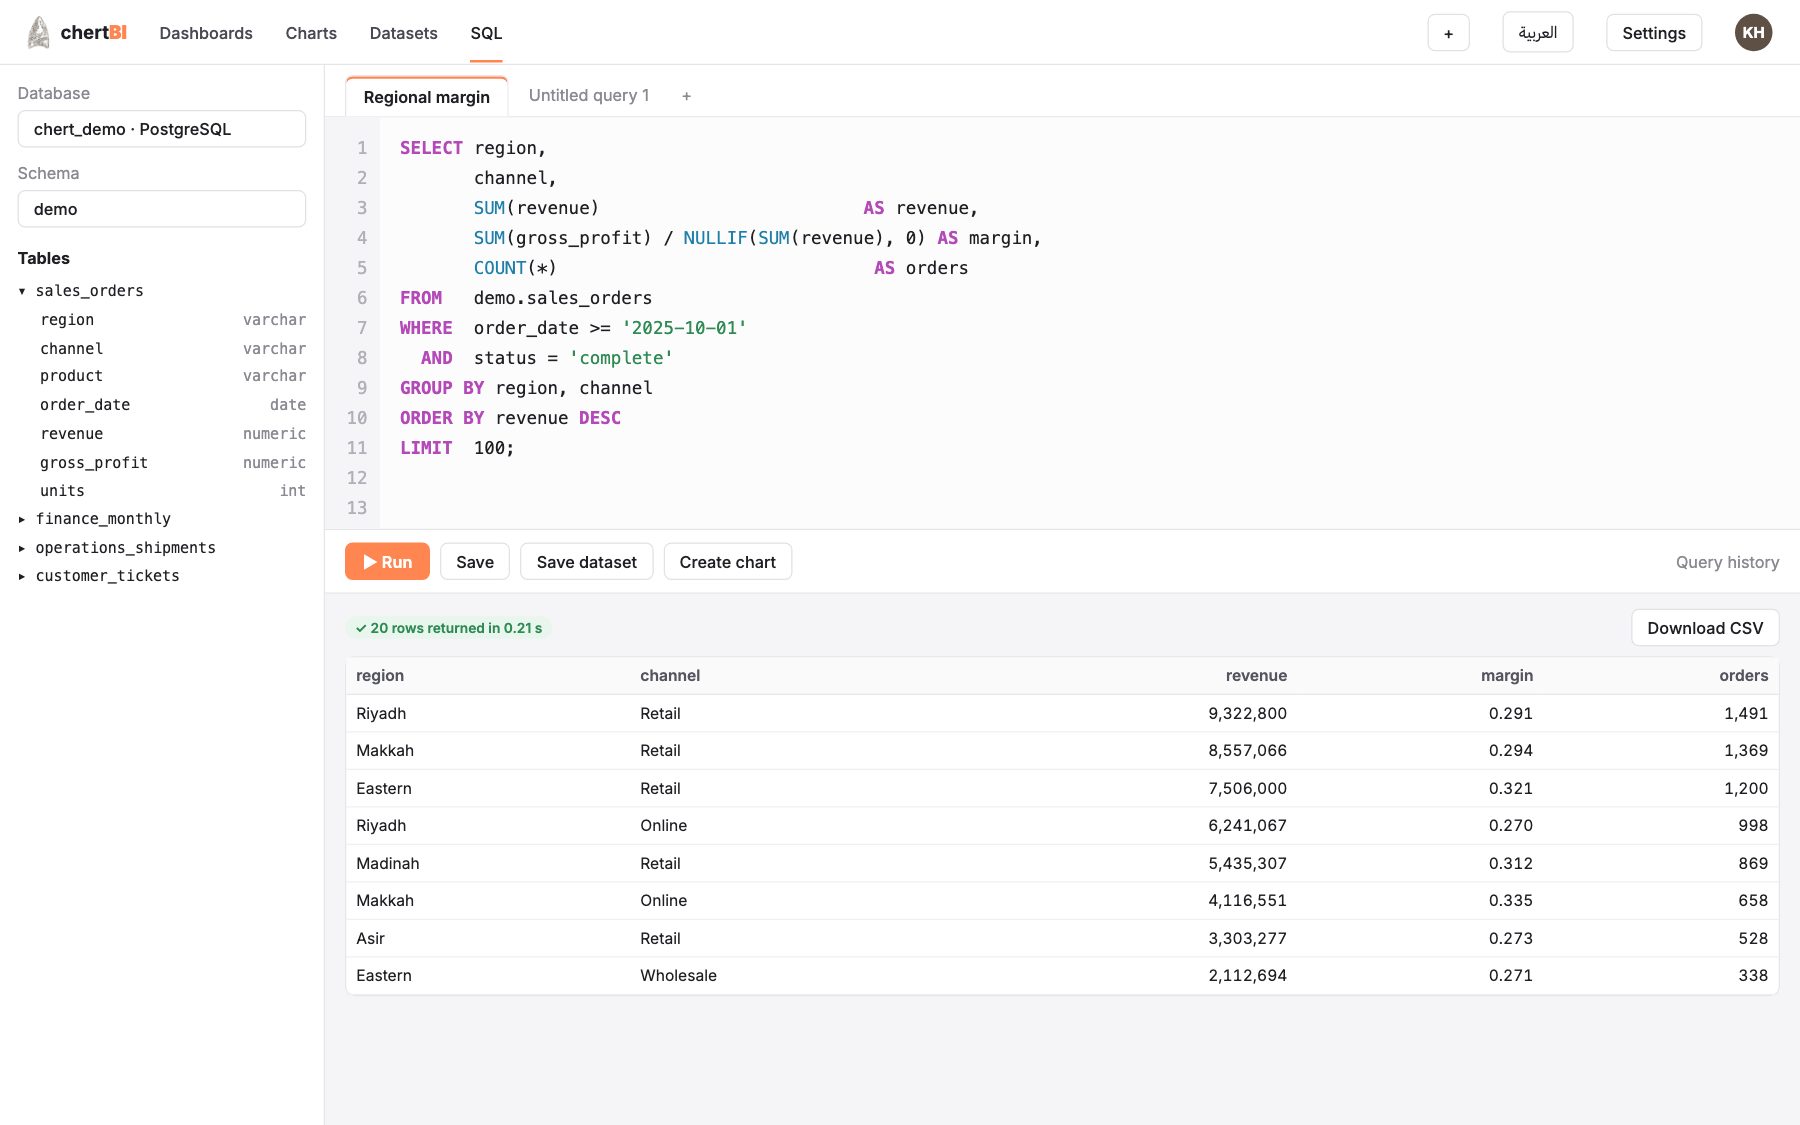
A multi-tab SQL workbench with a schema browser, autocomplete and query history. Save the query, download the result, or turn it straight into a dataset or a chart.
Powered by
Stage 04 / 10
Ask without code
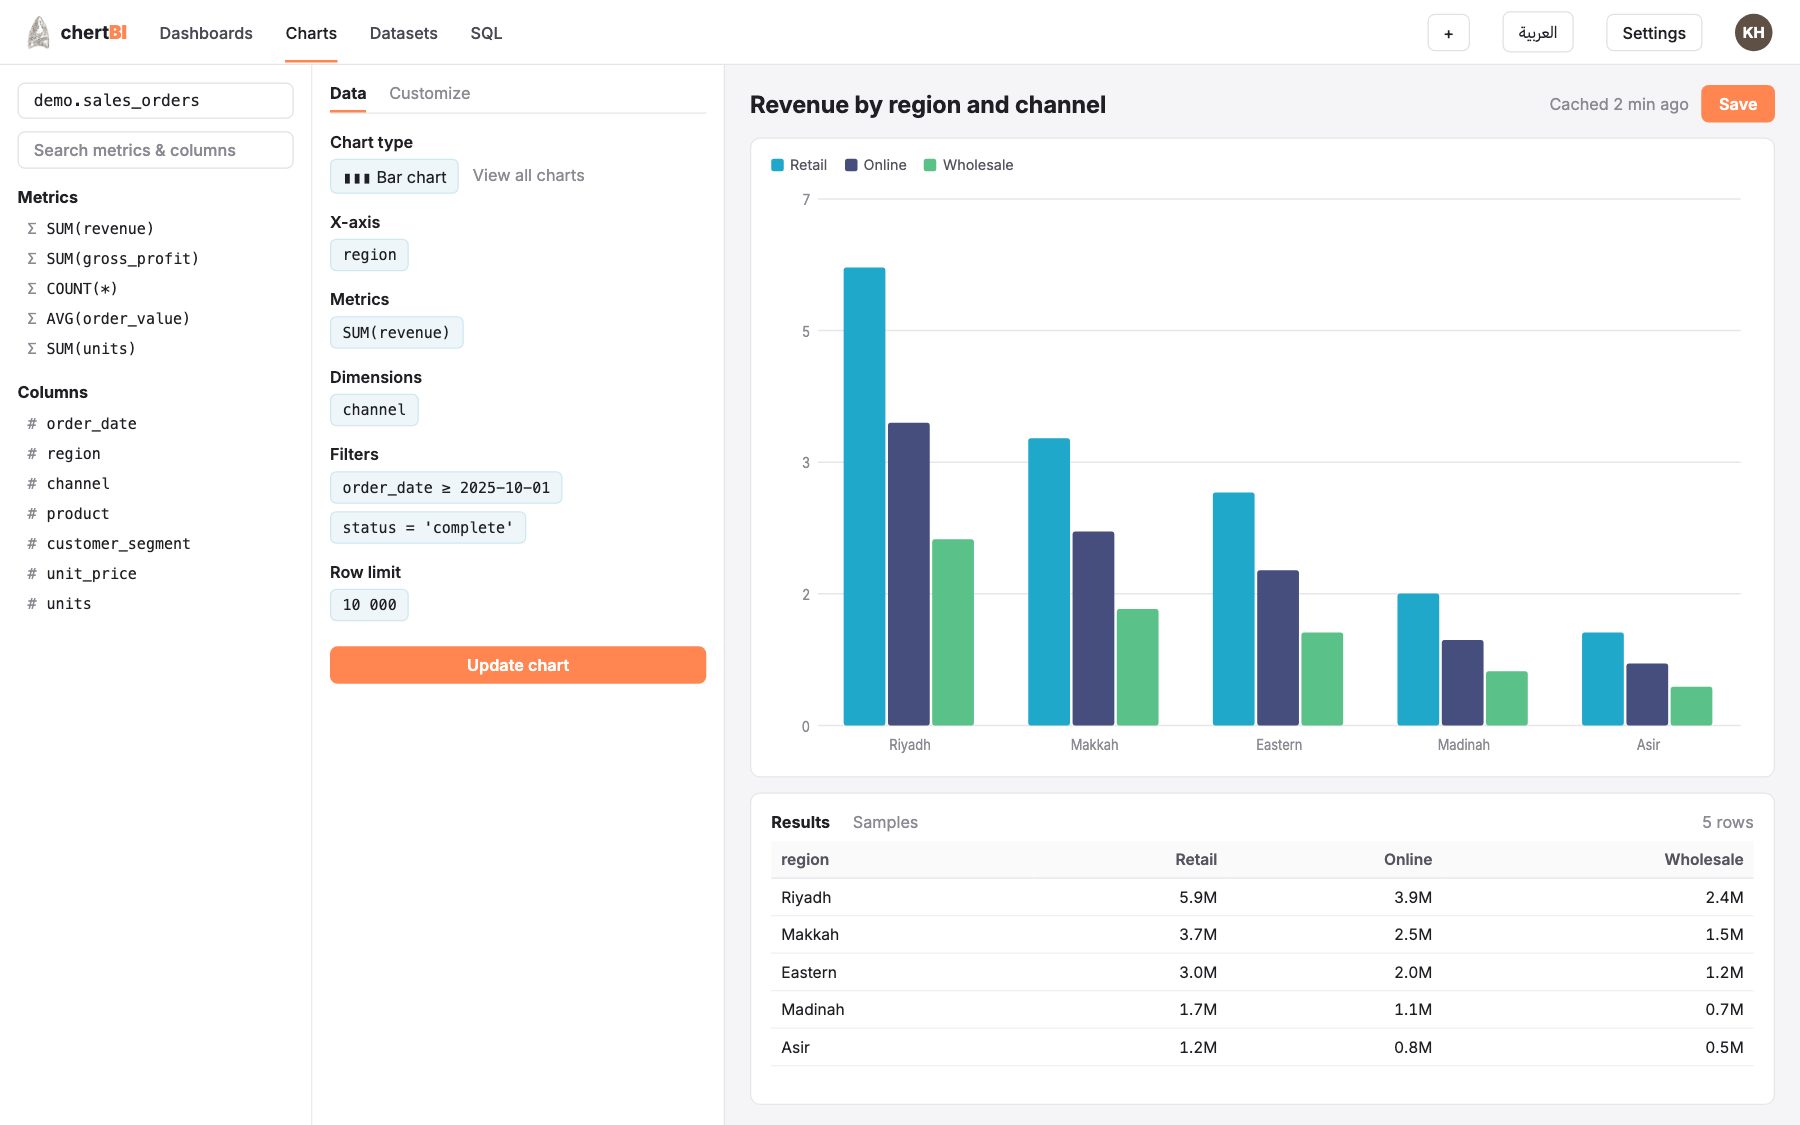
Pick a dataset, drop in metrics, dimensions, filters and a time grain; the query engine writes the SQL for your database's dialect and the result appears beside the chart.
Powered by
Stage 05 / 10
The right picture for the question
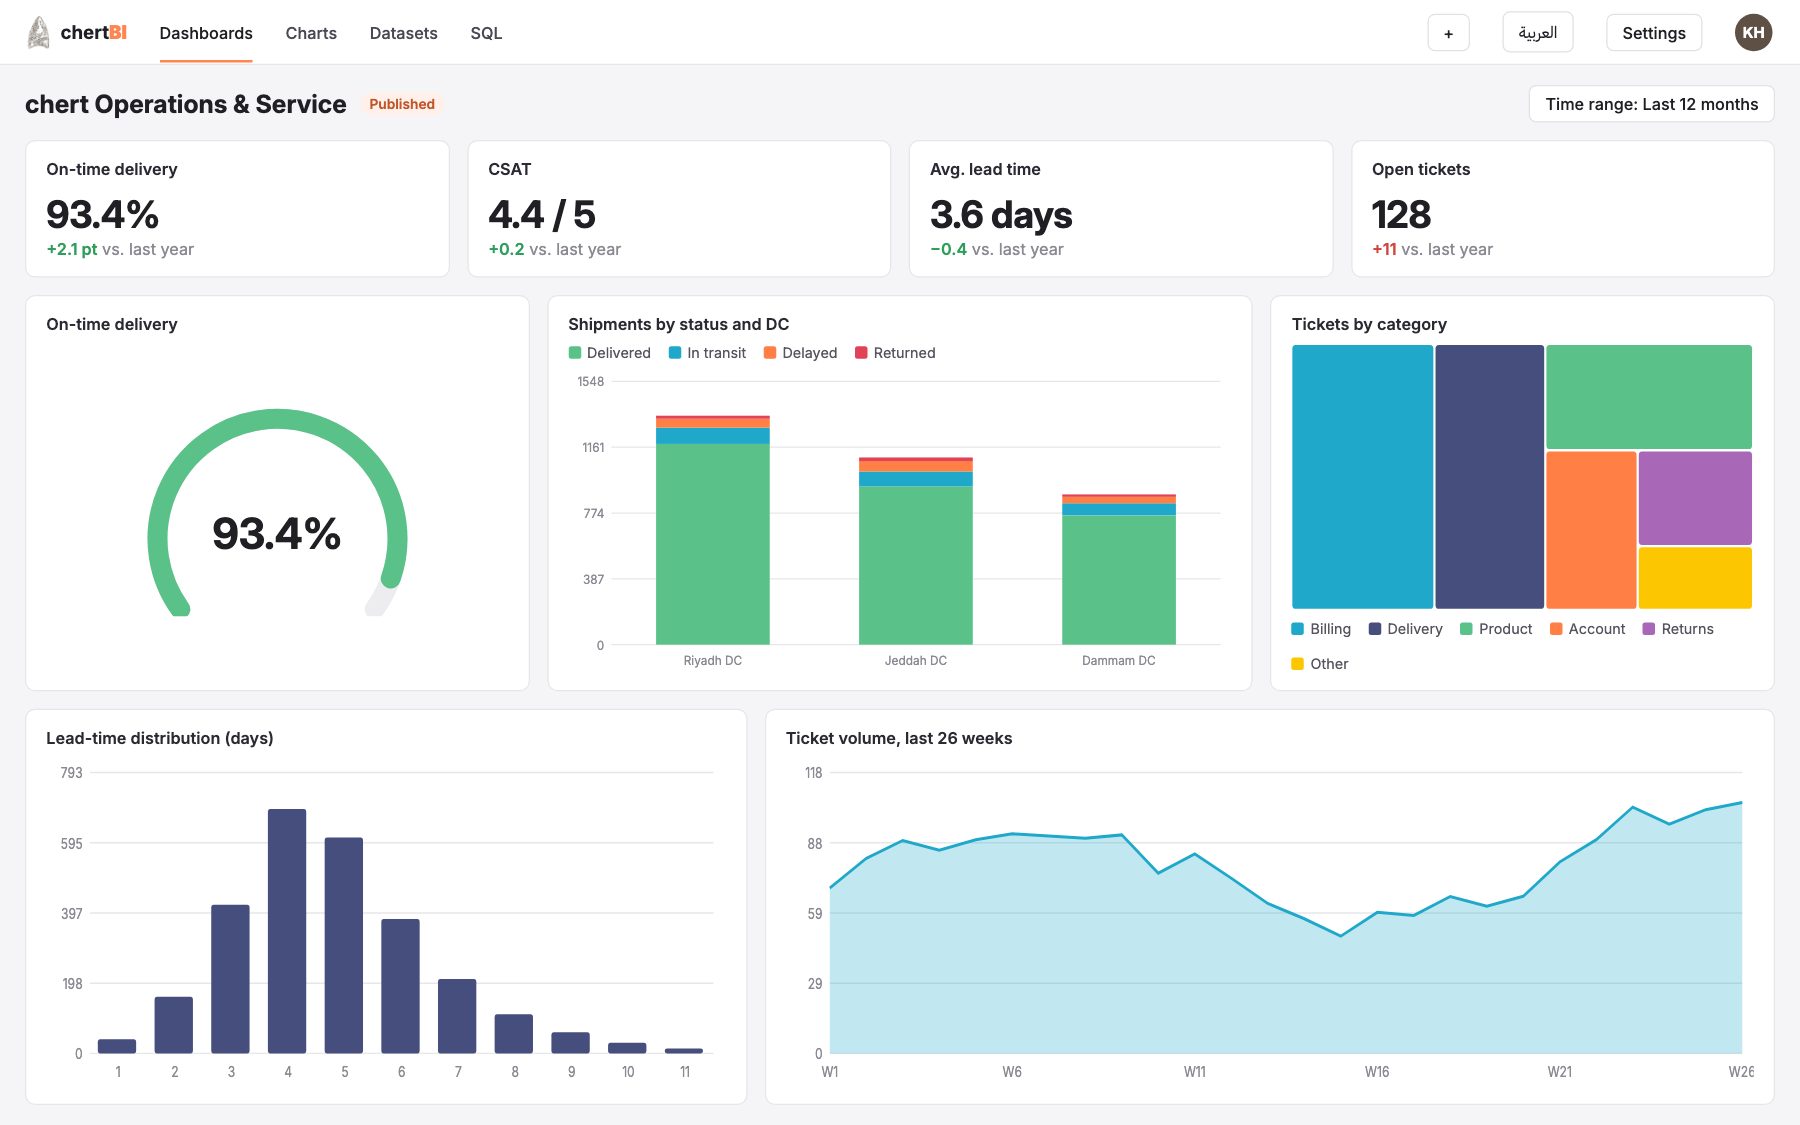
More than forty chart types — trends, comparisons, distributions, flows, hierarchies and maps — with number formats, colour schemes and annotation layers.
Powered by
Stage 06 / 10
Dashboards people actually use
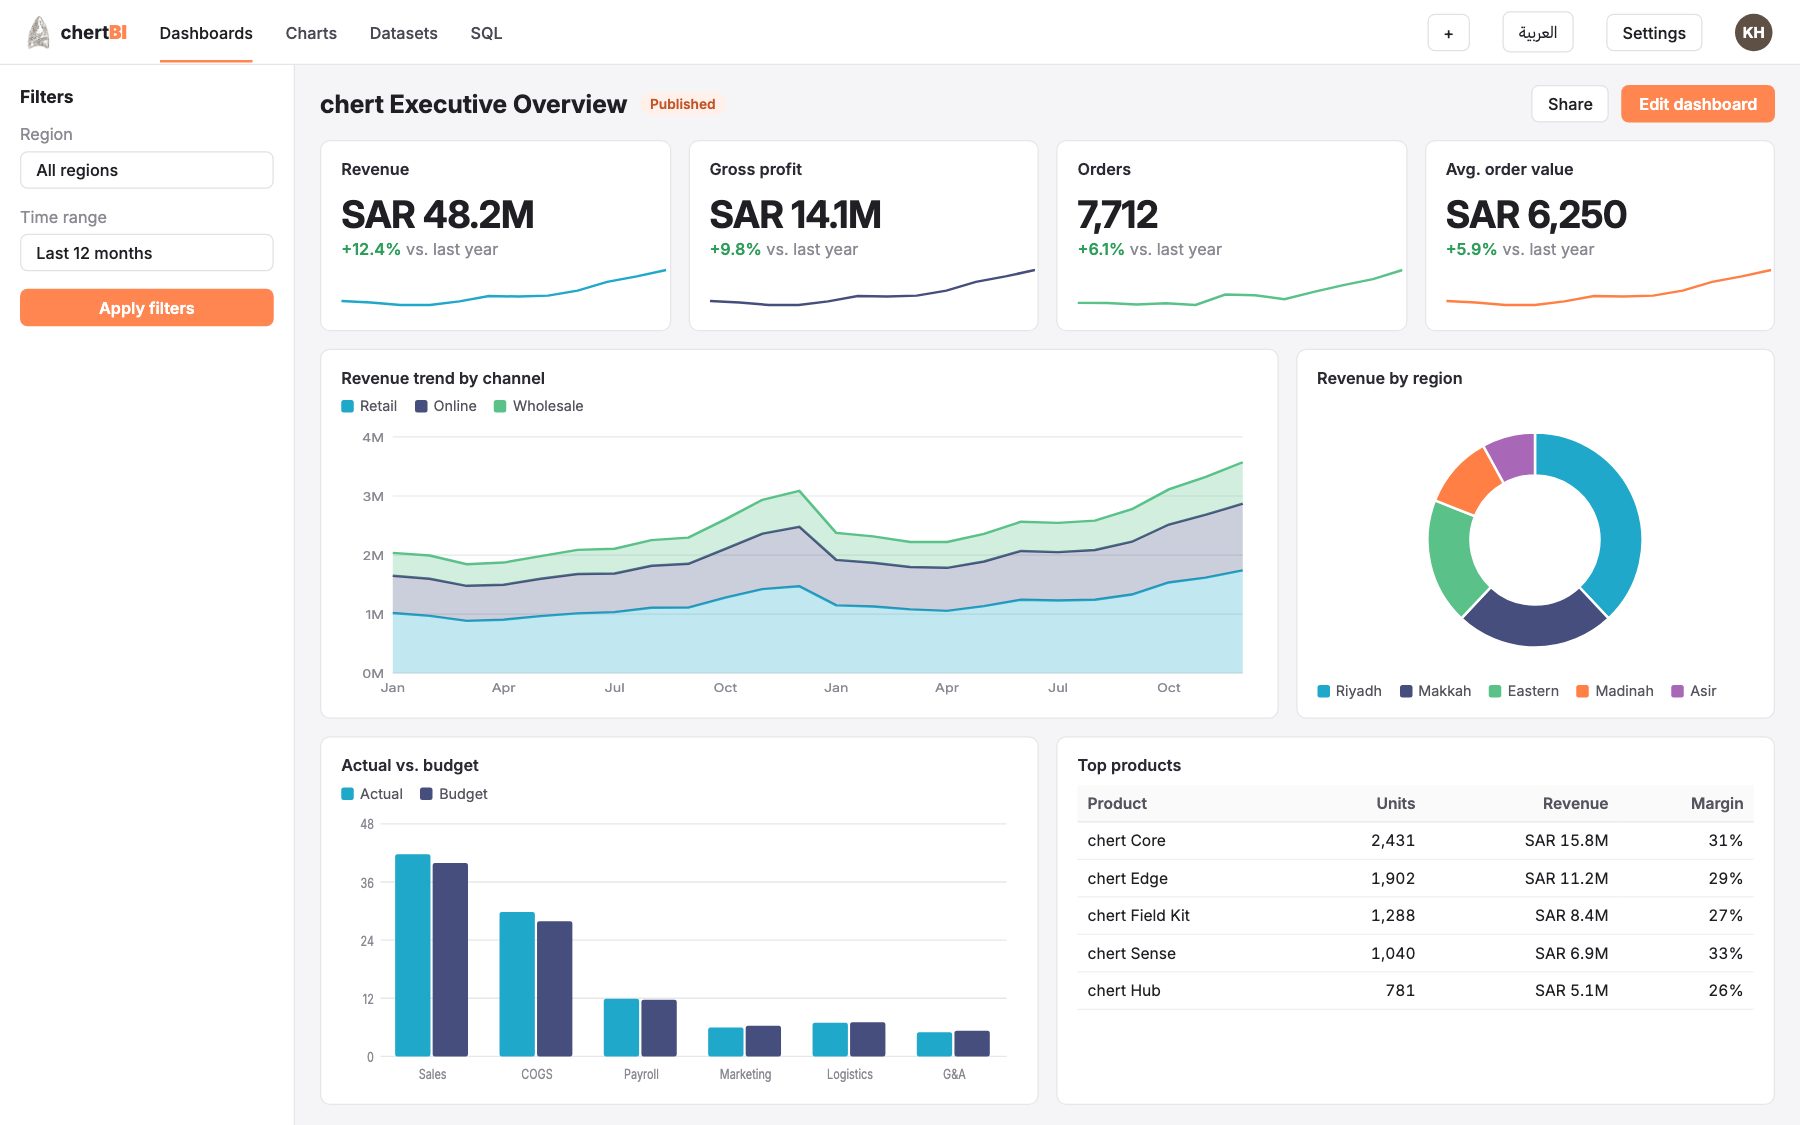
Drag charts onto a grid with tabs, rows, headers and markdown. Publish when ready, mark favourites, and share a permalink that remembers the filters.
Powered by
Stage 07 / 10
From the headline to the row
Native filters for values, ranges and time; click any slice to cross-filter the whole dashboard; drill by another dimension or drill to the detail rows behind a number.
Powered by
Stage 08 / 10
Fast the second time — and the hundredth
Chart results, filter state and explorer state are cached in Redis, so a busy morning does not hit the database a hundred times. Force a refresh whenever you need fresh numbers.
Powered by
Stage 09 / 10
Answers where the work is
Export to CSV, Excel, image or PDF, or embed the dashboard itself inside chertERP: the ERP backend asks for a short-lived guest token and the embedded view renders bare, in the ERP's own screen.
Powered by
Stage 10 / 10
The right people, the right rows
Roles decide who can view, explore or write SQL; database and dataset permissions decide what they can reach; row-level security decides which rows they ever see.
Powered by
Interactive architecture
Select any component to learn what it does, or play a journey and watch a question travel through the platform.
Where questions are asked and answers are read.
Everything people build: charts, dashboards, queries.
Meaning, SQL generation, speed and memory.
Your databases stay where they are; chertBI reads them.
Who sees what — down to the row.
Self-hosted, backed up, rebuilt from source.
Details appear in the panel above the diagram.
Every function, at a glance
No per-seat licences and no modules to bolt on. Every capability below shares one semantic layer, one permission model and one cache.
The chart library
A selection from the library. Every chart is built in the explorer, filtered by the dashboard and cached by the same engine.
One platform, many engines
chertBI is built from Apache-2.0 open-source code and compiled from its own source tree. Each engine below does one job well and runs on your server — none of them is exposed to the internet.
The workspace
Dashboards, explorer, SQL workbench, datasets and administration — bilingual, right-to-left in Arabic, in any modern browser.
app.chertbi.comEmbedding
The embedded SDK and guest-token flow that put live dashboards inside chertERP — or any host app you allow.
chertERPQuery engine
Writes dialect-correct SQL from every chart, applies row-level security, enforces limits and timeouts.
Internal engine · never exposedSemantic layer
Datasets, virtual datasets, metrics and calculated columns — certified once, reused in every chart.
Internal engine · never exposedVisualisation
More than forty chart types on a modern charting engine, with formats, colour schemes and annotations.
Internal engine · never exposedCache · Redis 7
Holds chart results, filter state and explorer state, and backs per-user rate limiting.
Internal engine · never exposedMetadata · PostgreSQL 16
Users, roles, connections, datasets, charts, dashboards and saved queries — dumped every night.
Internal engine · never exposedWorkers · Celery
Async queries, scheduled reports and alerts — included, and enabled when a workload calls for it.
Optional tier · enable when neededGateway · Nginx
Terminates TLS with auto-renewing Let's Encrypt certificates and routes chertbi.com and app.chertbi.com.
Internal engine · never exposedInside the platform
Illustrative views of the chertBI workspace, drawn with the chert demo story — Saudi regions, chert products, three distribution centres — in both languages.
Why chertBI
Metrics are defined once in the semantic layer and certified — the board pack, the ops screen and the ERP widget all say the same "revenue".
A complete right-to-left Arabic workspace, a language switch on every page and the chert identity throughout.
The workspace, metadata, cache and backups run on your servers. Your databases are queried in place. No per-seat licences, no telemetry.
Built to live inside chertERP with guest tokens and tenant isolation — and just as useful on its own at app.chertbi.com.
Roles, per-database and per-dataset permissions, row-level security, secure sessions and an action log — from day one.
Built from Apache-2.0 code with licences intact and compiled from source — no lock-in to a vendor's roadmap.
Tell us where your data lives today — we will set up a walkthrough with your tables, your metrics and your chertERP screens.